Running Multiple Instances of PicoLog
PicoLog, our data logging software, can collect data from a number of converters at once, but it always records data at the same rate from each converter, and starts sampling from each converter at the same time. In more complex applications, you can get around these limitations by running several copies (or 'instances') of PicoLog at the same time. You do this by creating a separate settings file for each instance, then loading each settings file into its own copy of PicoLog.
Here is an outline of the procedure.
- Attach to the PC the converter or set of converters that you want to use with the first instance of PicoLog.
- Start PicoLog, select New Settings from the File menu, then follow the sequence of dialogs to set up your converters.
- You must use real-time continuous mode, as other modes will not work with multiple converters or with multiple instances of PicoLog.
- Select Save as... from the File menu, then Settings files (*.pls) from the drop-down box, then Save.
- Disconnect the first converter and attach the next (or the next set), then repeat the steps above.
- Close PicoLog.
Once you have a settings file for each converter or set of converters, you will need to start PicoLog Recorder from the command line, as follows.
- From the Windows Start menu, select Run...
- Type
c:Program FilesPico Technologyplw32.exe mysettings1.pls
(where c:Program FilesPico Technology is your installation directory and mysettings1.pls is your first settings file).
- Repeat the two steps above for each of your settings files (for example, mysettings2.pls, etc).
You should now have a separate instance of PicoLog for each settings file. The maximum speed of data acquisition will depend on the number of converters in use and the number of instances of the program.
In normal operation PicoLog data logging software collects up to 1 million readings in one data file and then stops.
There are however a number of options to decide what happens at the end of a run, these are selected from Settings | Recording within PicoLog Recorder.
Repeat immediately is useful when you need to collect more than 1 million readings, or wish to have several smaller files (one per day for example)
Repeat after delay is useful for taking snapshots of data, a typical use would be collecting one minute of high speed data every hour.
Scroll mode discards the oldest samples, this is useful if you only wish to have a record of the most recent data.
IP networking with PicoLog
The PicoLog IP socket facility can be used to take measurements on one or more computers, but record the data on another computer.
The measurements are taken by PicoLog running on one computer called the client. Another computer, the server, requests the data via an IP network.
For a step by step guide visit:https://www.picotech.com/applications/ip_networking.html
It is possible to use more than one converter on a single PC and display all channels with the same copy of PicoLog. For example if you need sixteen channels of temperature measurement, use two eight channel
TC-08s on the same PC. Different products can also be mixed on the same PC, for example a TH-03 could be used at the same time as an ADC-200.
Multiple-converter operation is available only in 'Real time continuous' mode. Each converter must have a separate port: you can use either standard serial/parallel ports or our USB adapters
To configure PicoLog to use multiple converters:
- Choose File | NewSettings
- Check the 'use multiple converters' box
- Continue the set up process in the normal way
PicoLog general hints and tips
Below are some 'cool features' within PicoLog software that you may not be aware of:
Support for multiple converters. With PicoLog software you can use a mix of our products on the same PC at the same time. For example you could use a TC-08 to record temperature on 8 channels and a ADC-16 to record voltages from another 8 channels. PicoLog will record and display from all 16 channels.
To enable support for multiple converters, select File | New Settings and click on the 'enable multiple converters' button.
'Save As' options. When you collect data in PicoLog it is saved as default as a PicoLog data file (.PLW extension). By selecting File | Save As from the PicoLog recorder you also have a number of other choices, these are:
Settings Files (.pls) which contain all the settings, but no data, this is useful for storing different setups for later recall.
Text files (.txt) which store the data in simple ASCII text format which many programs can import.
Comma separated values (.csv) which most spreadsheets and data base programs can import.
Running multiple copies of PicoLog
PicoLog is designed so that you can collect data from multiple devices connected to the same PC, the only limitation is that data is collected from each device at the same rate.
If you have more than one converter connected to one PC and need to log data from each converter at different rates, you can run two copies of PicoLog Recorder.
- Set up PicoLog for the first converter and save the settings as a PicoLog settings file (*.pls) eg. fred.pls You then need to set up PicoLog for the second converter and save the settings with a different filename, eg jack.pls
- Quit PicoLog Recorder
- Start the first copy of PicoLog with the command c:picoplw32.exe fred.pls
- Start the second with the command c:picoplw32.exe jack.pls
- You now have two copies of PicoLog Recorder running, enabling you to collect two independent data runs.
Trigger in PicoLog (fast block only)
Triggering in Picolog is available, but only in fast block mode. To use this open the Recording window:
File | New Settings In the 'Recording Method' dropdown box select the option 'Fast Block'. When using this mode you will only be able to use one convertor at a time. Click OK.
Select the Unit that you want (Not all units are available, only units that can be used with Picoscope). Click OK.
Add the channel and select 'trigger'.
Click the 'Trigger enable' check box.
Choose the direction that you want the trigger to action on. eg rising the voltage is increasing. Falling the voltage is decreasing.want the trigger to action.
PicoLog Starts in Player mode, not recorder mode - Why?
When running PicoLog, you minimise the Recorder window, then it will shrink to a small "PL" logo in the bottom right of the tool-bar. When you wish to restore to the original window size, just double-click on that small "PL" logo. The display will return to recorder as before. If, at any time Recorder is running, even when minimised, you double click on the main PicoLog icon on the desk-top, then Player will start. (This will happen even if Recorder has "crashed" as it is often still running in the background. In that case, go to Windows Task manager, "Processes", highlight "plw32.exe" and click the "End Process" button.) Now when you run Picolog again, recorder will start.
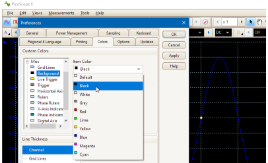
Q. I'm fed up with my bright white display. How do I turn the background black in PicoScope 6?
A. Introduce your PicoScope to the dark side (or any color you like) by clicking Tools > Preferences... and selecting the Colors tab. In the Custom Colors panel, open up the Misc options and select Background. You can now choose a color from the presets, or add a custom color. Click Apply to check out your work, and OK when you're done.
Don't forget to check the colors of other items and make sure they still stand out – your new background color may make them harder to see!
Your color settings are saved automatically. To reset them, go back to the Colors tab and click Reset Colors to Default.
Finding glitches with PicoScope
Recently, in PicoScope 6.4.10, we added the ability to show in the waveform buffer overview only the waveforms that failed a Mask Limit Test. If you're not normally interested in Mask Limit Testing, you may have overlooked this feature, but it can be very useful when you are looking for an infrequent glitch.
Imagine that you have a square wave with an occasional spike that you want to capture. You could switch PicoScope to Persistence mode. In time this will catch the spike, but the display will show an overlay of a large number of waveforms with noise, making it difficult to see the exact shape of the spike. The new Mask Limit Test feature allows you to capture the spike without adding the clutter of the Persistence display.
To use this feature:
-
Set up PicoScope to trigger on individual pulses in the square wave. For best results, use "Rapid" trigger mode, which captures successive waveforms with minimal trigger re-arm time.
-
Go to Tools > Masks > Add Masks, select the channel of interest, and click Generate. This generates a testing mask, which appears as a colored area surrounding the waveform.
-
If necessary, edit the mask to include the normal waveform and exclude the spike. (Right-click, Mask, Edit.)
-
Start PicoScope capturing, and wait until the waveform buffer is full.
-
Inspect the waveform buffer using the Buffer Overview button. This will initially show all the waveforms captured, but if you open the drop-down menu and select "Show only Mask Limit Test failures", only the captured waveforms with a spike will be displayed. You can select any of these waveforms to display in the main view.
Zooming in during slow sampling with PicoScope
Q. I wish to be able to clearly see a sine wave (zoom in), while I am recording data in slow sample mode, to scan it for any unwanted disturbances. For that, I need the signal to "flow" on my screen from right to left, so that I don't need to continuously move my zoom window to follow the signal. Currently, the signal simply plots itself from left to right, which makes it impossible to be always zoomed in to the most recent data. Additionally, I wish to be able to set a trigger event, but I wish to also be able to see the data even when the trigger is not satisfied in case some unexpected event occurs so that I can start recording manually. Is that feasible?
A. Yes. If you set up PicoScope so that it is running in streaming mode, usually 100 ms/div or slower depending on the preferences setting, you will see a trace running across the screen. If you now select Single trigger mode and set up a trigger condition that does not normally occur, you will have a trace that continually streams but doesn't go past the trigger point. Zooming in on this will give you what you are looking for.
Working with multiple waveforms
Q. How can I open multiple PicoScope .psdata files as different channels (or something similar) in order to use math channels on them?
A. You cannot open multiple .psdata files, but you can get the result you seek using Reference Waveforms. Open one .psdata file at a time, copy it into the Reference Waveforms list, then repeat with all .psdata files. You can then combine the Reference Waveforms with live inputs or with each other using Math Channels. (Video: How to use Reference Waveforms.)
Waveform overlays
Did you know that PicoScope can display a saved waveform in the background for comparison? This feature is built into PicoScope, but you might not have discovered it yet. It's called Reference Waveforms.
You will find the Reference Waveforms feature in the Tools menu. Selecting the command opens a dialog that shows all available and saved waveforms. To save a waveform and display it in the background, select the source channel under the "Available" list and click Duplicate. The new reference waveform will then appear in the "Library" list. Next, click OK and the reference waveform will appear in the PicoScope window. You can drag it up and down, or scale and offset it, in the same way as a live waveform. You can also drag a live waveform over it for comparison.
Keep your PicoScope up to date: download the latest version now
Save-on-Trigger in PicoScope
We recently made it much easier to save-on-trigger (save each waveform to a file as soon as it is captured) in PicoScope. This is useful for saving data from unattended experiments or long-term tests. Just follow these steps:
-
Set up PicoScope to trigger on your signal. "Repeat" trigger mode is best for this procedure.
-
Open the Tools menu and select Alarms.
-
In the Alarms dialog, set the Event option to "Capture".
-
Edit the Action and change it to "Save Current Waveform".
-
In the File box, browse to a suitable directory and enter a filename. Bear in mind that PicoScope will save a new file on every trigger event, so make sure that the chosen directory has enough free space.
-
Don't forget to tick the Enable Alarm box at the bottom of the dialog.
-
Click OK to return to PicoScope. Click the Start button, and PicoScope will start saving-on-trigger.
The Alarms feature is extremely flexible, and as well as saving files it can sound an audible alarm or execute a program, triggered by a variety of events.
Make sure your PicoScope is up to date: download R6.4.28 today
Frequency Meter in PicoScope 4000 Series
If you have a PicoScope 4000 Series scope, you probably didn't know that it has a built-in frequency meter. We recently added a feature to the PicoScope software to make use of this. When the scope is connected, go to the Channels toolbar and open the Coupling Mode drop-down list (the one that includes "DC" and "AC" coupling modes). You will see a new mode called "Frequency". If you select this, PicoScope will draw a graph of frequency against time, in the range 0 to 2 kHz. This is useful for graphing the output of frequency-output devices such as vortex air-flow meters, and saves you from having to build a frequency-to-voltage converter.
Autosetup Button in PicoScope
We have added an autosetup button to the toolbar of our PicoScope software application (release 5.12.5) for PC Oscilloscopes. Pressing this button sets up the timebase, channels and trigger configuration to display any signals that the software finds on the oscilloscope's inputs. The new feature supports all our converter products.
Oversampling with the PS3000 series
Oversampling is a technique used with oscilloscopes and spectrum analyzers to reduce noise and effectively increase resolution and dynamic range.
To look at an 1kHz sine wave on an oscilloscope, you might record 1000 samples at 10kS/s. If however you take 4000 samples at 40kS/s and then average together blocks of 4 samples you will have reduced any random noise pick up and effectively increased the resolution of your sampled data by 1 bit.
The PicoScope 3206 can sample at 200MS/s and collect up to 1 million samples. This performance is far more than is required for some applications such as when looking at audio signals. By oversampling the data by 256 times, you can effectively increase the resolution of the oscilloscope from 8 bits to 12bits.
The main disadvantage of oversampling is that it can slow down the screen update rate as more samples have to be transferred back to the PC, with the fast USB2.0 interface of the PicoScope 3000 series this effect is minimal. The other potential disadvantage is that oversampling acts like a low pass filter so has the effect of reducing or removing high frequency signals. This is usually not an issue for the spectrum analyser where you have chosen the frequency range of interest, but can be an issue when using the oscilloscope as it may suppress spikes and other signals you wish to observe.
With the PicoScope 3000 series it is possible to set different oversample settings for the oscilloscope and spectrum analyser. To do this open win.ini (usually in c:windows) in a text editor such as notepad. Next find the section that starts with [PicoScope for Windows] and add two additional lines as follows:
MaxScopeOversample=1
MaxSpectrumOversample=64
In the above example, we have set the scope oversample to 1 (no oversample) this ensures any high frequency spikes will be displayed properly. If you wish to filter an oscilloscope trace to remove random noise, try using the Current | Filtered display mode instead.
By setting the spectrum oversample to 64 we effectively gain 3 extra bits of resolution, so increase the dynamic range of the spectrum analyser. The max oversamples can be set between 1 and 256, but please note that it is not always possible to oversample. For example if you set the spectrum analyser frequency to 100MHz then the hardware is already sampling at 200MS/s therefore no oversampling is possible.
To save a trace in Picoscope as a JPEG (.jpg) file:
File | Save as |
In the dropdown box labelled 'Save file as type' select the jpg extension. Now enter the name of the file in the 'File Name' box, not forgetting to include the .jpg extension and removing the astrix (*). Finally click OK or select the directory where the file is to be saved to and then click OK.
For many measurement applications, noise is a big concern. A typical example in the automotive field is measuring injector current using a current clamp. The signals from the current clamp are only a few mV in amplitude, yet nearby are ignition signals of many kV.
The best way to minimize noise is to try to eliminate it at source, in the above example keep the current clamp as far away from ignition components as practical and ensure all connecting leads are screened.
Physical precautions as described above will help minimise noise pickup, simple software filtering can often be used to further reduce its effects.
PicoScope oscilloscope software has several display modes that can be used to reduce noise pickup, the differences between these modes are described below and can be selected from the settings | options menu:
Current (Unfiltered)
This is the default display mode, it takes all the data captured by the oscilloscope and maps it onto the PC monitor using a min/max algorithm. This ensures any fast transients are displayed, but will also act to highlight any high frequency noise.
Current (Filtered)
This mode applies a simple low pass filter to remove high frequency noise from the oscilloscope display. This mode would be ideal for the automotive application described.
Average
This mode build up an average trace based on all cycles captured. This is useful for removing random noise from repetitive signals.
Min, Max and Average
This displays this displays a shaded area showing the minimum and maximum of all cycles captured. In addition it displays the average trace as well. As with the average mode, noise is removed from repetitive signals, in addition the shaded area gives an indication of how noisy the signal is.
A number of automotive users have asked about optimising the oscilloscope settings for measuring secondary ignition waveforms and in particular ensuring that peak kV is measured correctly.
Ignition waveforms can be difficult to capture as the event occurs over a relatively long period of time, yet contains a spike (plug kV) of very short duration. This combination requires both a high sampling rate and a large buffer memory.
The first step is to ensure you are using PicoScope R5.09.4 or later (in PicoScope select Help | About to check the release number). If you need to upgrade, this can be done free of charge from the web site. Downloading the standard version of PicoScope will not remove the automotive features from the automotive software.
Most users will start from the Automotive drop down menu - this gives an acceptable waveform in most cases. If however you lengthen the timebase to view multiple ignition waveforms, then the peak kV spikes may not be displayed reliably. This problem can be solved by increasing the number of samples captured. To do this select Setting | Options and click on the "Advanced" button. Next change the maximum number of samples to 32,000 for the ADC-212/3. Click on OK twice to complete the changes.
To save the settings for future use, either select File | Save Settings,
or save a reference waveform using File | Save As.
PicoScope software has over thirty automated measurements available such as frequency, rise time, duty cycle, THD, SINAD, etc.
These measurements are selected from the Settings menu and appear at the bottom of the oscilloscope or spectrum window. As well as displaying current values, it is also possible to display minimum, maximum and average values. Additionally it is also possible to set test limits and alarms, in this way it is possible for example to set an audible alarm to occur every time the rise time of a signal exceeds a certain threshold.
More information on measurements can be found in the PicoScope help file.
PicoScope, our oscilloscope software has the useful ability to save a waveform to disk (complete with a time / date stamp) each time a trigger event occurs. This can prove invaluable when tracking down intermittent faults, especially those that happen infrequently over a period of hours or days.
The trigger mode can be enabled by selecting Settings | Trigger. By default a maximum of 100 waveforms will be recorded to disk (to avoid filling you harddrive). This default can be overridden by editing the settings in the WIN.INI file as shown below:
-
Using a text editor such as notepad, open WIN.INI (usually in c:windows)
-
Find the section called [PicoScope for Windows]
-
Add a line MaxSOTFiles=200 (where 200 is the maximum number of files you wish to save)
-
Save WIN.INI and restart PicoScope
Thick trace lines in PicoScope
If you are using PicoScope for a demonstration to a group of people, or are visually impaired, you may find that the trace is difficult to see. It is possible to thicken PicoScope's line thickness to increase visibility
-
Choose File | Setup | Colours
-
Adjust the line thickness
-
Choose OK
Loading reference waveforms in PicoScope
A common requirement with oscilloscopes is to compare 'live' waveforms with stored 'reference' waveforms.
This can easily be done in PicoScope as follows:
-
Open the reference waveform
-
From the View menu select 'Freeze/thaw one'
-
Press the new scope icon to open a second oscilloscope window
-
Display the 'live' waveform in the second oscilloscope window
If the two scope windows have exactly the same settings (timebase, trigger, voltage etc) then the waveforms can be overlaid by choosing 'New Composite' from the View menu. More details on this can be found in the PicoScope help file manual under 'Composite View'.
PicoScope general hints and tips
Below are some 'cool features' within PicoScope software that you may not be aware of:
Bar graph option in meter view. As well as the normal numeric view, there is also an option to turn on a bar graph view. To enable this, just select Settings | Parameters and click on the bar graph tick box.
Trace thickness. If you wish to view scope or spectrum traces from a distance, or if you have a large number of people viewing the screen, you may find it helpful to use a thicker line to display the trace. This can be done by selecting File | Setup | Colours, which gives you the option of thin, medium and thick trace lines. You can also change the colours of the traces and backgrounds using this menu option.
Technical tip - measurements and alarms in PicoScope
PicoScope has over thirty automated measurements. Oscilloscope measurements include frequency, rise time and pulse width. Spectrum measurements include THD, SFDR and SNR.
For each measurement, upper and lower alarm limits can be set. This makes it possible for example to set an alarm if a pulse width goes out of specification. To add an alarm, first add the Measurement you wish to use using "Settings | Measurements | Add"
>From the resulting dialog box enter minimum and maximum values to be used then click OK. From "Measurements | Options" you can select the action to occur on alarm, the choices are to either stop the scope (so capturing the error on the screen) or to sound an audible alarm.
Technical Tip: Faster Screen Update Rate in PicoScope
*In PicoScope there is a setting that limits the number of screen updates per second. This is to prevent PicoScope from taking all of the PC's resources and preventing other applications from working. You can find the "Maximum displays per second" control by selecting File | Setup | Display.
The best setting depends on the PC you are using and the product you have connected.
* When using a parallel port product without internal buffer memory (ADC-100 and below) it is best to set the figure around 10. If you have a very slow PC, a lower number may be better.
* When using parallel port products with a buffer memory, try a setting the control to 20, or for a fast PC you can increase this to 30 (the maximum allowed).
* For USB products the best setting is normally 30, unless you have a slow PC.
Spectrum Analyser Options
The spectrum analyser built into the PicoScope software has a number of powerful options that can be accessed by selecting 'options' from the 'settings' menu. These include:
No of spectrum bands - this defines how many "bins" the frequency range will be divided into. It can be set between 256 and 16384 (product dependant). Lower numbers give a faster update time, higher numbers give more resolution.
Window Type - this gives seven options on how the edges of the block of sampled data are filtered to reduce distortion. For most users the default window (blackman) is adequate, the PicoScope help file gives more details on which window should be used for which application.
Display Mode - this offers three options. "Normal" displays the spectrum for the current cycle. "Average" gives a moving average of successive cycles which is useful for removing random noise. "Peak" displays the maximum of all cycles (useful for bandwidth testing of filters and amplifiers.
X & Y Scales. These give options for the vertical scale to be in dB or Volts and the horizontal frequency scale either to be in linear or logarithmic form.